
Keyword
Marine ecosystems
2 record(s)
Type of resources
Available actions
Topics
Keywords
Contact for the resource
Provided by
Formats
Representation types
Update frequencies
Status
Scale
panaceaKeywords
GEMET keywords
-
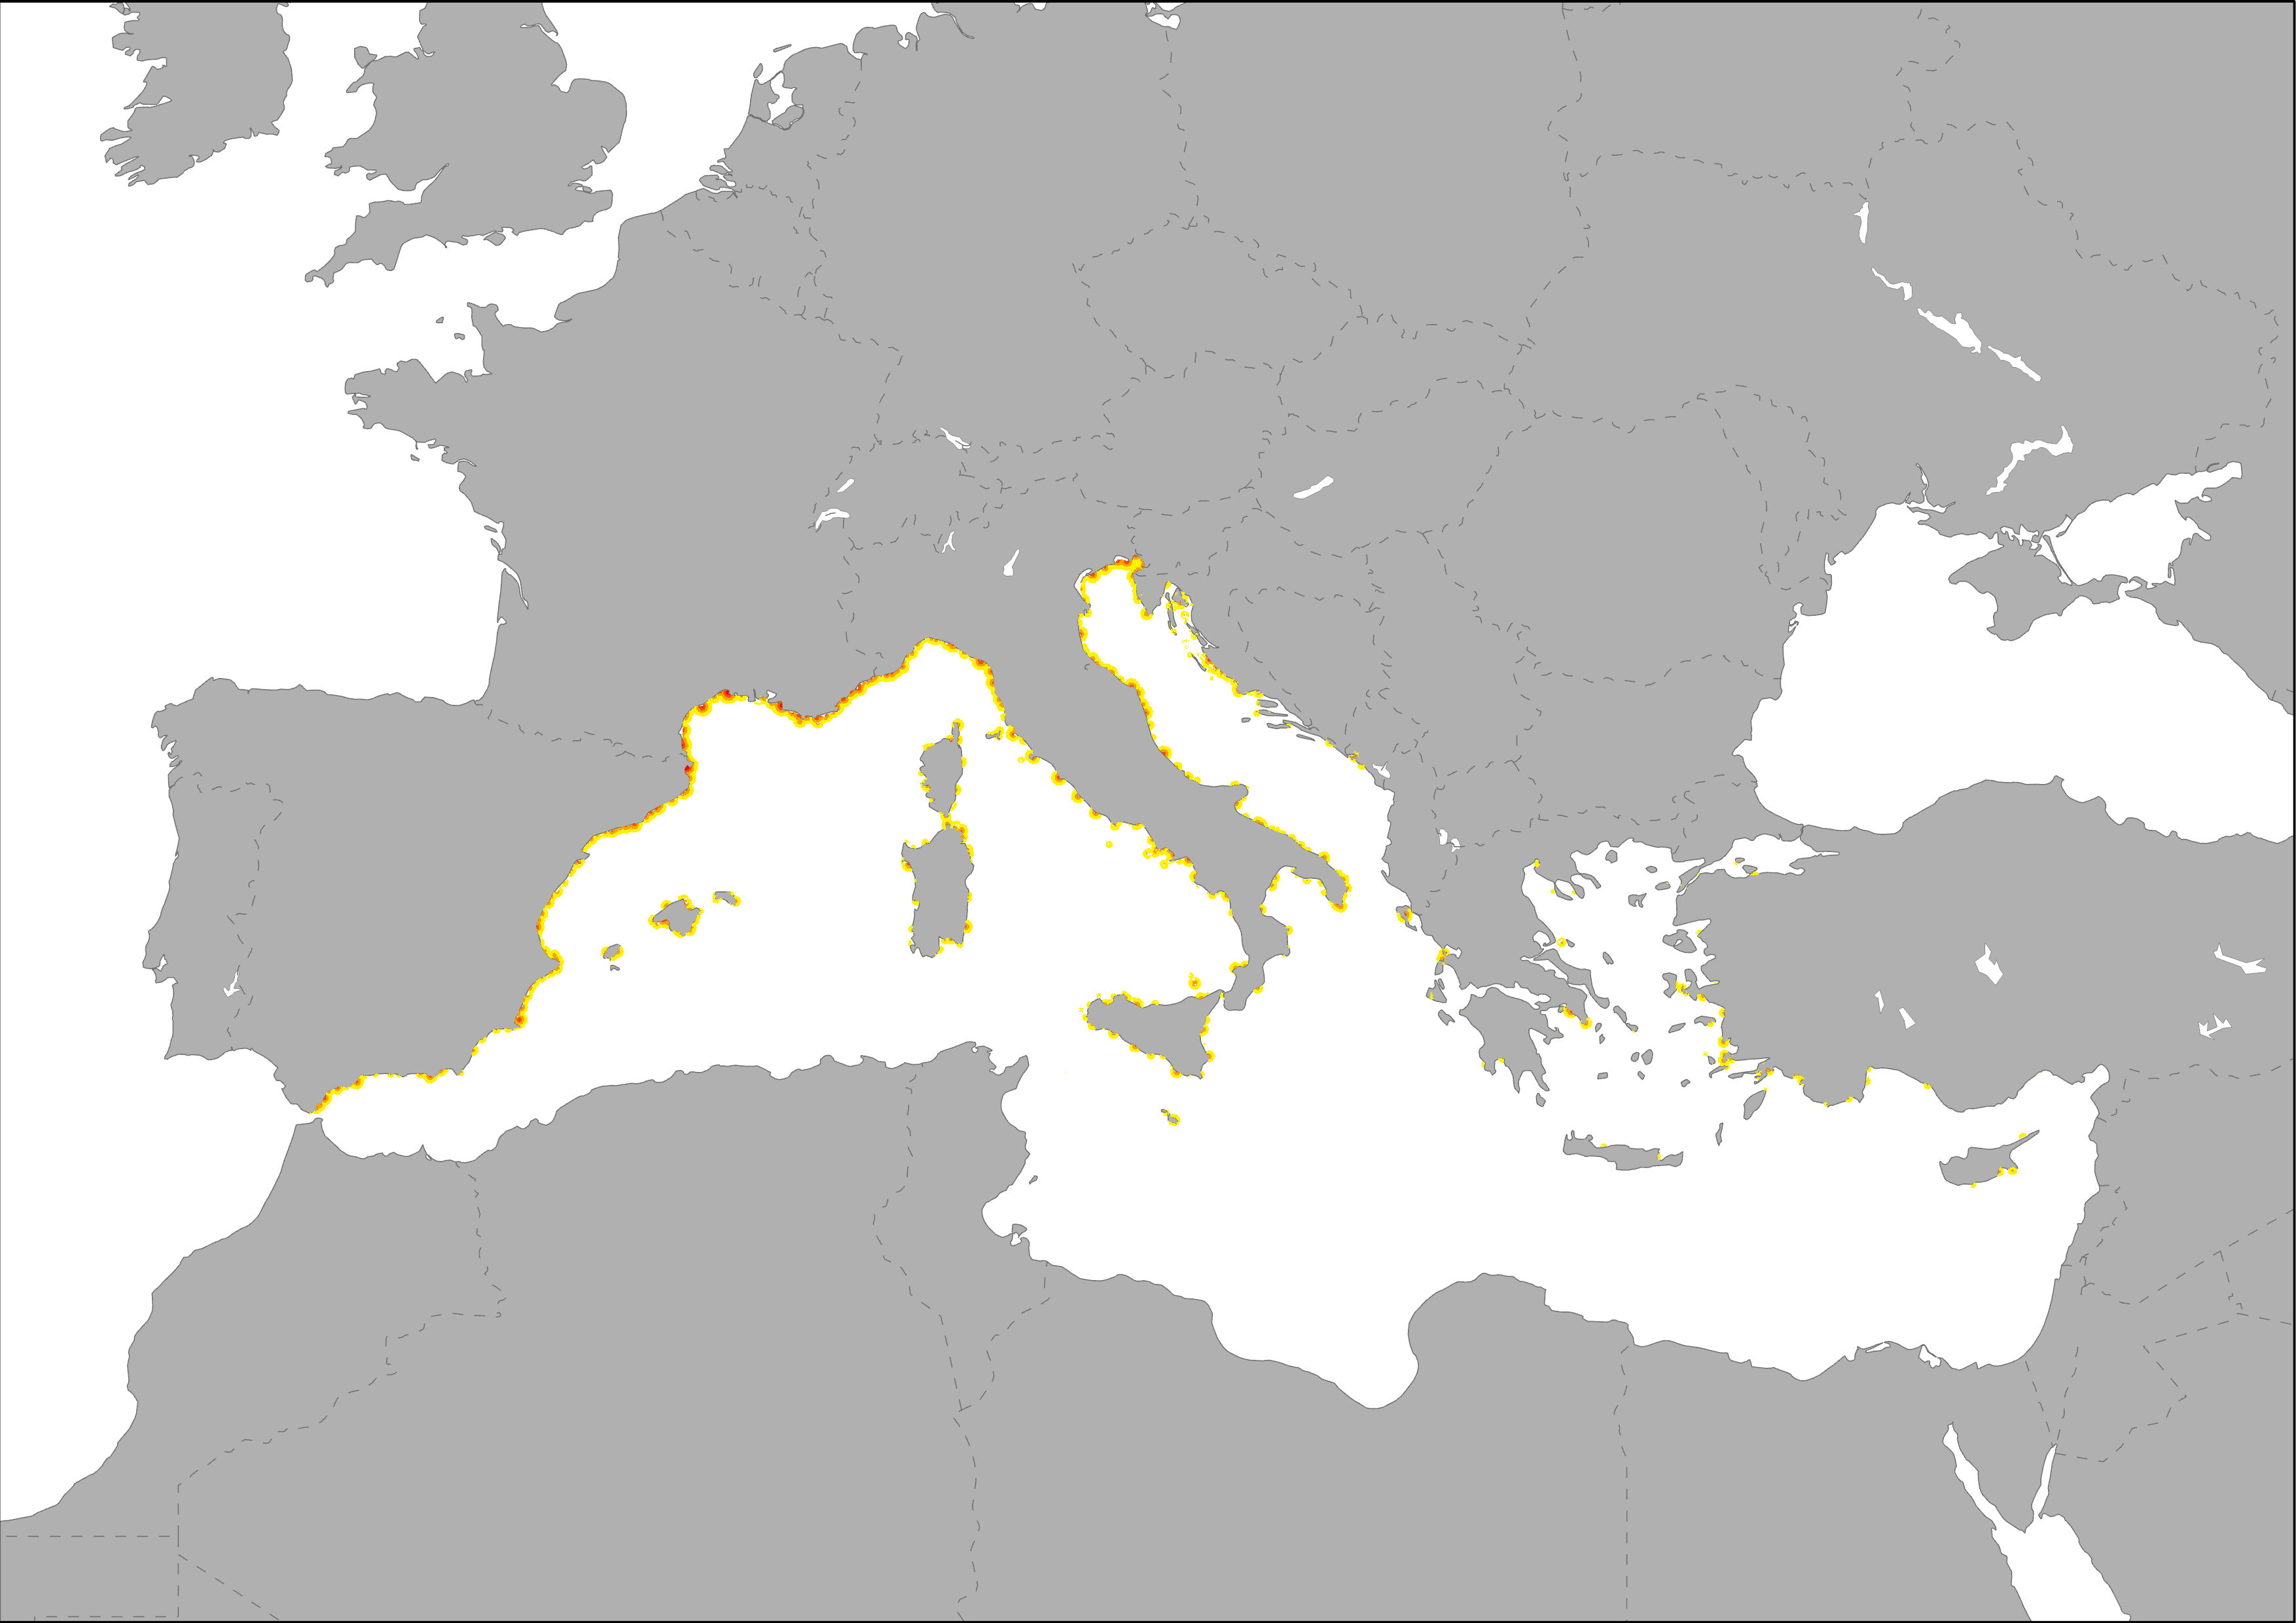
The map highlight the potential intensity of pressure related to marinas on marine ecosystems. The dispersal of yachting port-derived pollution was modeled as a diffusive plume up to 20 km based on the data on mooring capacity of each yachting port. The spatial proximity of yachting ports increases the overall pressures. The influence was modeled as a buffer with and exponential decay based on self calculations using mooring capacity of each yachting port. Calculations were made following the same methodology developed for ESaTDOR Project (ESPON, 2013). The extension area is based on HELCOM, 2012 and it is the theoretical maximum expansion distance for pressures generated by recreational shipping.
-
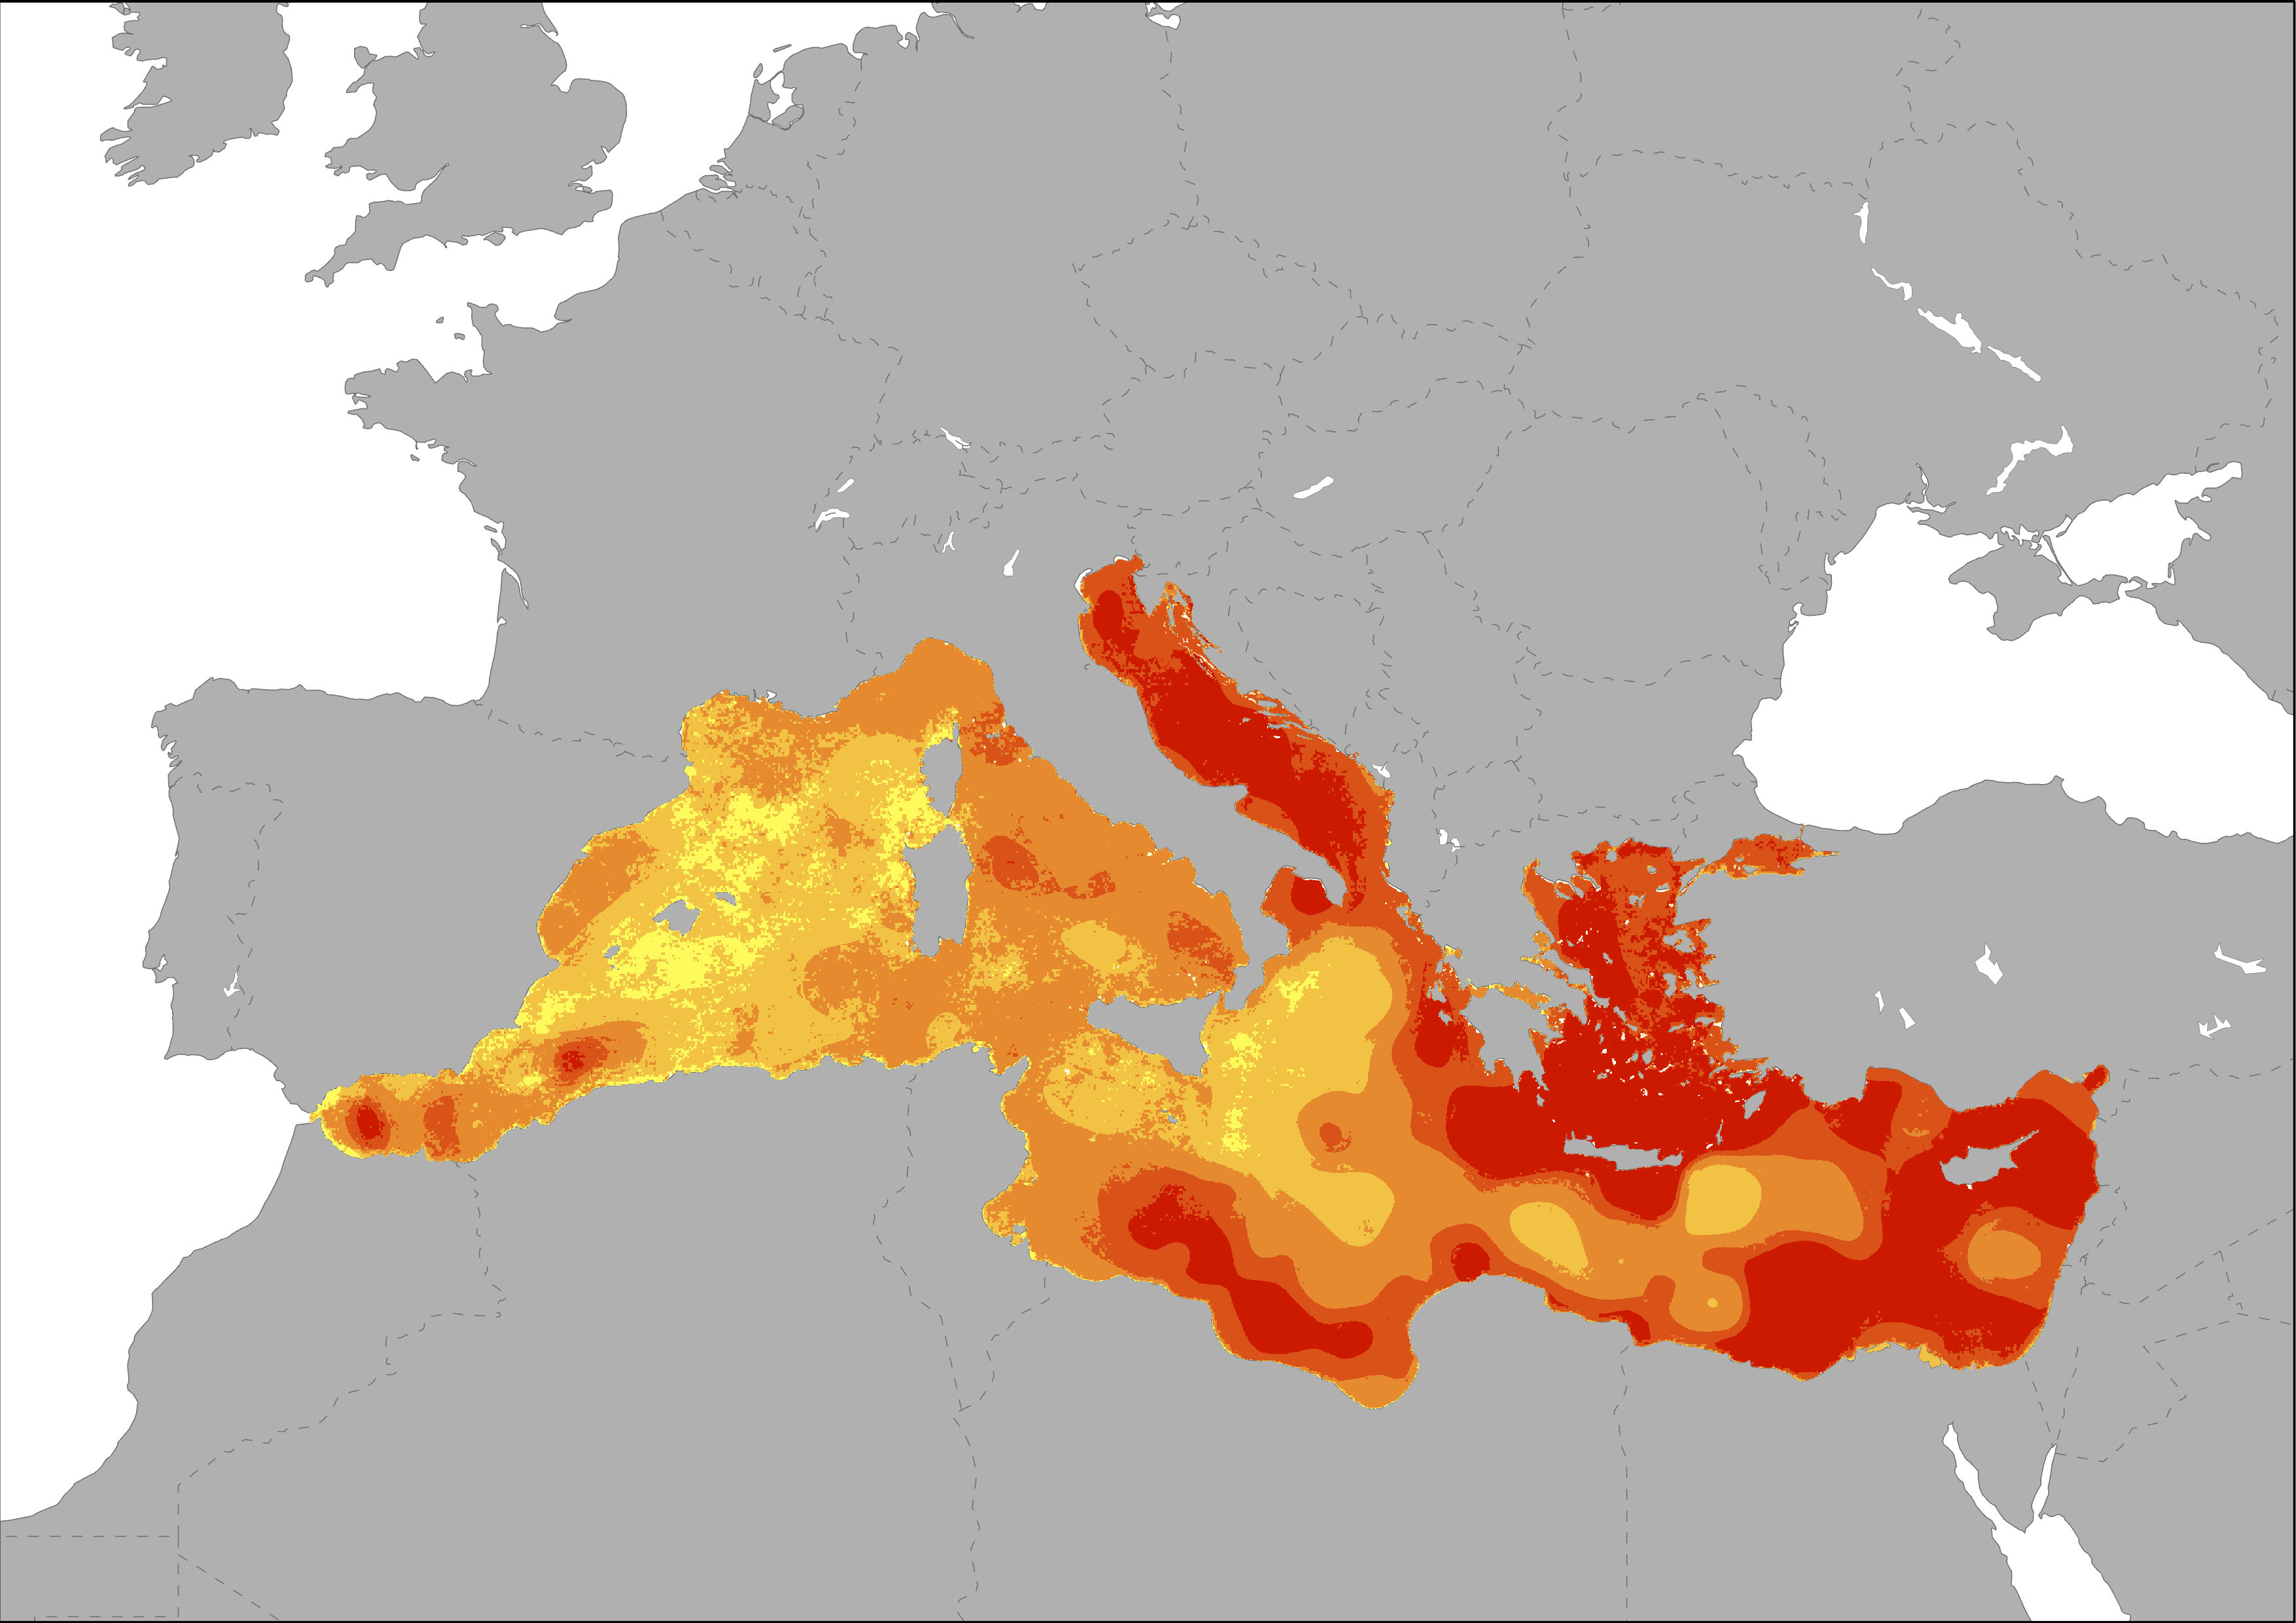
This indicator represent the pressure on marine ecosystems due to climate change on a continuous scale of intensity from low to high. The pressure on marine ecosystems due to climate change was determined by a composite indicator based on the combined influence of two variables: sea surface temperature (SST) anomalies, where the temperature exceeds a threshold value like the long-term mean (differences in anomaly frequency between 2000-2005 and 1985-1990), and sea level rise (SLR), which show the sea level rise trends in mm/year.